
Monitoring water quality in aquaculture and fish farming
Aquaculture — the farming of fish, crustaceans, mollusks, and aquatic plants — is a major source of food and economic activity worldwide. Regardless of system type (ponds, cages, tanks, raceways, or recirculating aquaculture systems [RAS]), maintaining optimal water quality is crucial for animal health, growth rates, and production efficiency.
Accurate, real-time monitoring of pH, dissolved oxygen (DO), salinity, ammonia, oxidation-reduction potential (ORP), and turbidity ensures optimal environmental conditions and minimizes disease risk and mortality.
Parameters in Aquaculture
In aquaculture, portable instruments are used to measure several critical water quality parameters — not just dissolved oxygen — to keep aquatic animals healthy and productive. Here are the main parameters typically measured with portable instruments:
- Dissolved Oxygen (DO)
- Most critical; fish and shrimp require specific DO levels.
- Low DO can cause stress, disease, or death.
- Temperature
- Water temperature affects metabolism, oxygen solubility, and feeding rates.
- Some species have narrow optimal temperature ranges.
- pH
- Measures acidity/basicity of the water.
- pH affects ammonia toxicity and overall fish health.
- Salinity (or Conductivity)
- Important for species in brackish or marine environments.
- Helps maintain osmotic balance in aquatic animals.
- Ammonia (NH₃/NH₄⁺)
- Toxic waste product from animal metabolism and decomposition.
- Even low concentrations can be deadly.
- Nitrite (NO₂⁻) and Nitrate (NO₃⁻)
- By-products of the nitrogen cycle.
- High nitrite is highly toxic; high nitrate can cause long-term health issues.
- Turbidity
- Measures water clarity.
- High turbidity can stress fish, clog gills, and block light for aquatic plants.
- Carbon Dioxide (CO₂)
- High CO₂ can lower blood pH in fish (acidosis).
- Important in systems with high stocking densities.
- Alkalinity
- Acts as a buffer against pH changes.
- Helps stabilize water chemistry.
- Chlorine
- Especially important when using treated tap water.
- Even small amounts can be harmful to aquatic life.
- ORP
- ORP is like a "health meter" for aquaculture water — it helps you catch problems early (like dirty water, low oxygen, or bad bacteria) before they stress or kill your animals.
Sources and references:
- Boyd, C. E., & Tucker, C. S. (1998). Pond Aquaculture Water Quality Management. Springer.
- Timmons, M. B., & Ebeling, J. M. (2013). Recirculating Aquaculture Systems. Cayuga Aqua Ventures.
- Hargreaves, J. A., & Tucker, C. S. (2004). Managing Salinity in Pond Aquaculture. Southern Regional Aquaculture Center, SRAC Publication No. 4603.
- FAO (Food and Agriculture Organization). Water Quality in Freshwater Fish Culture. FAO Fisheries and Aquaculture Technical Papers.
- Liao, I. C., & Chien, Y. H. (2011). Effects of salinity on aquaculture species. Aquaculture Research, 42(3), 293–298
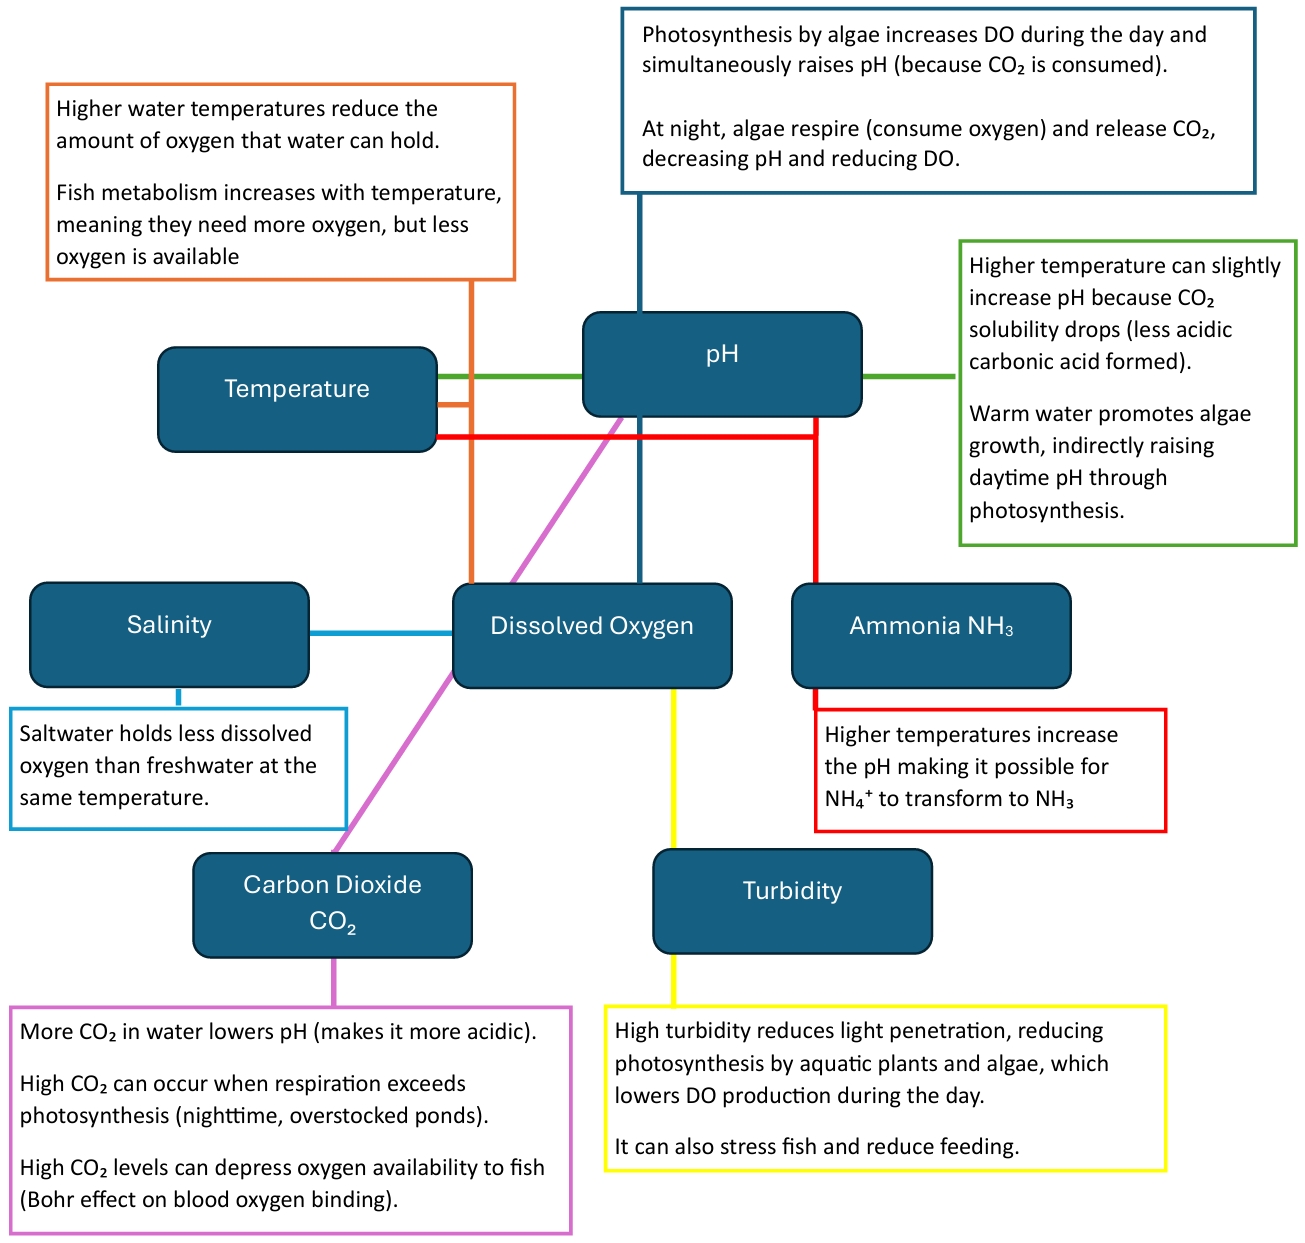
Relationships Between Water Parameters
The different water quality parameters in aquaculture are closely interconnected, and changes in one often affect the others.
| Parameter | Influences | Result |
|---|---|---|
| pH | NH₃ | When pH is higher than 9, ammonium converts to ammonia |
| NH₄⁺ | When pH is lower than 9, ammonia converts to ammonium | |
| Temperature | pH | Higher temperature can slightly increase pH because CO₂ solubility drops |
| DO | Higher water temperatures reduce the amount of oxygen that water can hold | |
| NH₃ | Higher temperature increases the pH, this can convert NH₄⁺ to NH₃ | |
| Turbidity | DO | High turbidity reduces light penetration, reducing photosynthesis by aquatic plants and algae, which lowers DO production during the day |
| CO₂ | pH | More CO₂ in water lowers pH (makes it more acidic) |
| DO | High CO₂ levels can depress oxygen availability to fish |
The Importance of Dissolved Oxygen in Aquaculture Farming
Dissolved oxygen (DO) is one of the most critical water quality parameters in aquaculture, directly impacting the survival, growth, and health of aquatic organisms. Fish, shrimp, and other farmed species rely on oxygen dissolved in water for respiration. Insufficient DO levels can lead to stress, reduced feeding, slower growth, increased disease susceptibility, and ultimately, high mortality rates (Boyd, 1998).
Sources such as Boyd and Tucker (2012) emphasize that optimal DO concentrations should typically remain above 5 mg/L for most species to thrive. Levels below 3 mg/L can cause severe stress, while prolonged exposure to low oxygen can trigger fish kills. Furthermore, low DO can impair the function of beneficial nitrifying bacteria, slowing the breakdown of harmful ammonia and nitrites in the water (Timmons & Ebeling, 2010).
Several factors influence DO levels, including temperature, salinity, organic load, and photosynthetic activity. Warmer water holds less oxygen, and biological activities like decomposition consume oxygen, particularly at night when photosynthesis ceases. Thus, maintaining adequate aeration through mechanical devices (e.g., paddle wheels, air stones) is essential, especially in intensive aquaculture systems.
Monitoring dissolved oxygen is not only critical for animal welfare but also for farm profitability and sustainability. Regular measurements allow early detection of problems, preventing catastrophic losses and ensuring consistent production. As aquaculture continues to expand globally, careful management of DO remains a cornerstone of responsible and successful farming practices.
| Species | Ideal DO Level | Critical DO Level (Stress/Risk Zone) |
Notes |
|---|---|---|---|
| Tilapia (Oreochromis spp.) | 4.0–6.0 mg/L | <2.0 mg/L | Tilapia are fairly tolerant but do best with moderate oxygen levels. Below 2.0 mg/L, growth and immune function are significantly impaired. |
| Channel Catfish (Ictalurus punctatus) | 4.0–6.0 mg/L | <2.0 mg/L | Catfish are resilient but need sufficient oxygen for growth. Low DO (<2.0 mg/L) reduces feeding efficiency and increases stress. |
| Common Carp (Cyprinus carpio) | 4.0–6.0 mg/L | <2.0 mg/L | Carp can handle lower oxygen levels but growth and reproduction are limited below 3.0 mg/L. Below 2.0 mg/L, fish become lethargic. |
| Rainbow Trout (Oncorhynchus mykiss) | 8.0–10.0 mg/L | <4.0 mg/L | Trout are highly sensitive to low DO levels. Anything below 4.0 mg/L can cause stress, poor feeding, and health decline. |
| Atlantic Salmon (Salmo salar) | 8.0–10.0 mg/L | <4.0 mg/L | Salmon require high DO levels to thrive. Below 4.0 mg/L, growth rates slow, and the fish are more susceptible to diseases. |
| Shrimp (Litopenaeus vannamei) | 4.0–6.0 mg/L | <2.0 mg/L | Shrimp can tolerate some low DO, but poor oxygenation affects molting and survival. Levels <2.0 mg/L increase susceptibility to bacterial infections. |
| Barramundi (Lates calcarifer) | 5.0–7.0 mg/L | <3.0 mg/L | Barramundi prefer moderate oxygen levels. Low DO (<3.0 mg/L) causes weakness, poor appetite, and increased stress. |
| Asian Seabass (Lates calcarifer) | 5.0–7.0 mg/L | <3.0 mg/L | Like barramundi, they thrive with moderate DO levels. Below 3.0 mg/L, fish exhibit stress responses and decreased growth. |
| Koi Carp (Cyprinus carpio koi) | 5.0–7.0 mg/L | <3.0 mg/L | Koi require oxygen to maintain color vibrancy and overall health. Low DO (<3.0 mg/L) leads to weakness and poor coloration. |
The Importance of Temperature in Aquaculture Farming
Temperature is one of the most important environmental factors in aquaculture, influencing almost every aspect of aquatic life, from metabolism and growth to immune function and reproduction. Each species has an optimal temperature range where it thrives; deviations can cause stress, slow growth, and increase disease susceptibility (Boyd, 1998).
According to Timmons and Ebeling (2010), temperature affects oxygen solubility in water—warmer water holds less dissolved oxygen, compounding stress for farmed species. Furthermore, feeding rates, digestion, and nutrient assimilation are all temperature-dependent. For instance, tilapia grow best at 27–30°C, while rainbow trout require cooler waters around 12–18°C. Exposure to temperatures outside of these ranges can impair feeding efficiency, lower resistance to infections, and, at extreme levels, cause mortality.
Temperature also directly impacts the rate of ammonia toxicity. As water temperature rises, the toxic form of ammonia (NH₃) becomes more prevalent, increasing the risk to aquatic organisms (Boyd & Tucker, 2012). Therefore, maintaining stable and species-appropriate temperatures is critical not just for growth performance but also for overall water quality management.
Proper temperature control is essential in intensive aquaculture systems like recirculating aquaculture systems (RAS), where environmental conditions must be tightly managed to maximize productivity and animal welfare. Tools such as heating systems, shading, and aeration are often used to mitigate temperature fluctuations and ensure stable, optimal conditions year-round.
| Species | Ideal Temperature Range | Critical Temperature (Stress/Risk Zone) |
Notes |
|---|---|---|---|
| Tilapia (Oreochromis spp.) | 25–30°C | <18°C or >35°C | Tilapia are warm-water fish. Below 18°C, their growth slows, and below 12°C, they can suffer from stress and disease. Above 35°C, they experience heat stress. |
| Channel Catfish (Ictalurus punctatus) | 20–30°C | <15°C or >35°C | Catfish do well in moderate temperatures. Below 15°C, they stop feeding, and above 35°C, they become stressed and prone to oxygen depletion. |
| Common Carp (Cyprinus carpio) | 20–28°C | <10°C or >32°C | Carp are tolerant but thrive between 20–28°C. Below 10°C, their metabolism slows, and above 32°C, they risk oxygen stress and reduced growth. |
| Rainbow Trout (Oncorhynchus mykiss) | 12–18°C | <8°C or >22°C | Trout are cold-water species. Below 8°C, they become lethargic, and above 22°C, growth slows and health declines. |
| Atlantic Salmon (Salmo salar) | 8–18°C | <4°C or >22°C | Salmon are sensitive to warm water. Below 4°C, their metabolism decreases, and above 22°C, they experience heat stress and reduced feed conversion. |
| Shrimp (Litopenaeus vannamei) | 28–30°C | <22°C or >34°C | Shrimp prefer warm water. Below 22°C, they become stressed, and above 34°C, molting issues and disease risks increase. |
| Barramundi (Lates calcarifer) | 25–30°C | <20°C or >35°C | Barramundi thrive in moderate warmth. Below 20°C, their immune system weakens, and above 35°C, they experience heat stress and slow growth. |
| Asian Seabass (Lates calcarifer) | 25–30°C | <20°C or >35°C | Similar to barramundi, they prefer warmer water but suffer from heat stress above 35°C and slow metabolism below 20°C. |
| Koi Carp (Cyprinus carpio koi) | 18–24°C | <10°C or >30°C | Koi are temperate fish. Below 10°C, they become lethargic, and above 30°C, their immune system weakens, and they are prone to diseases. |
The Importance of pH in Aquaculture Farming
pH is a crucial water quality parameter in aquaculture, reflecting the balance between acidity and alkalinity in the water. It directly affects the physiological health of farmed species, the efficiency of biological filtration, and the overall stability of the aquatic environment (Boyd, 1998).
Most aquaculture species, such as tilapia, catfish, and shrimp, perform best within a relatively narrow pH range, typically between 6.5 and 8.5 (Boyd & Tucker, 2012). When pH falls outside of this range, it can impair respiration, reduce feeding rates, and weaken immune systems. For example, acidic conditions (pH below 6.0) can damage fish gills and limit oxygen uptake, while overly alkaline conditions (pH above 9.0) can increase the toxicity of ammonia (Timmons & Ebeling, 2010).
The relationship between pH and ammonia toxicity is particularly critical. At higher pH levels, a greater proportion of total ammonia exists in its toxic un-ionized form (NH₃), posing a greater threat to aquatic life. Similarly, low pH can hinder the activity of nitrifying bacteria responsible for converting ammonia into less harmful compounds, disrupting biofiltration and leading to water quality problems.
Natural factors like photosynthesis and respiration cause daily fluctuations in pH, especially in ponds rich with algae. Therefore, regular pH monitoring is essential to prevent harmful swings and ensure optimal growing conditions. Buffering the water with materials like agricultural lime can help stabilize pH and maintain a safe environment for the cultured species.
In short, maintaining a stable, appropriate pH is fundamental for maximizing health, growth, and production efficiency in aquaculture systems.
| Species | Ideal pH Range | Critical pH (Stress/Risk Zone) |
Notes |
|---|---|---|---|
| Tilapia (Oreochromis spp.) | 6.5 – 8.5 | <6.0 or >9.0 | Highly tolerant, but sudden drops below 6.0 cause stress and disease vulnerability. |
| Channel Catfish (Ictalurus punctatus) | 6.5 – 8.5 | <5.5 or >9.5 | Resilient species, but gill damage and feeding reduction occur at critical extremes. |
| Common Carp (Cyprinus carpio) | 6.5 – 8.5 | <5.5 or >9.5 | Carp are hardy but growth slows if pH stays outside the ideal range for long. |
| Rainbow Trout (Oncorhynchus mykiss) | 6.5 – 7.5 | <6.0 or >8.0 | Sensitive species; low pH (<6.0) severely affects respiration and survival. |
| Atlantic Salmon (Salmo salar) | 6.5 – 7.5 | <6.0 or >8.0 | Optimal performance within narrow pH; prone to skin and gill damage at low pH. |
| Shrimp (Litopenaeus vannamei) | 7.5 – 8.5 | <7.0 or >9.0 | Shrimp require slightly alkaline water; acidic conditions weaken shell and immune system. |
| Barramundi (Lates calcarifer) | 7.0 – 8.5 | <6.5 or >9.0 | Can tolerate slight variation but extreme low or high pH increases mortality risk. |
| Asian Seabass (Lates calcarifer) | 7.0 – 8.5 | <6.5 or >9.0 | Needs stable pH; fluctuating conditions harm digestion and osmoregulation. |
| Koi Carp (Cyprinus carpio koi) | 7.0 – 8.5 | <6.0 or >9.0 | Display color loss, stress, and susceptibility to parasites if pH strays too far. |
The Importance of Salinity in Aquaculture Farming
Salinity, the concentration of dissolved salts in water, is a critical environmental factor in aquaculture. It directly affects fish health, growth, reproduction, and system stability. Marine, brackish, and freshwater species each have different salinity requirements. Managing salinity effectively supports optimal physiological performance and reduces stress and disease risk.
Each species has a preferred salinity range. Marine organisms like shrimp (Litopenaeus vannamei) thrive at 15–35 ppt, while freshwater species such as tilapia (Oreochromis spp.) prefer <5 ppt. Brackish species, like milkfish, tolerate intermediate levels. Matching species with proper salinity is essential for efficient production.
Salinity affects the balance of salts and water within aquatic animals. Deviations from the optimal range force organisms to expend energy on osmoregulation, reducing growth and weakening immunity. Stable, species-specific salinity levels help ensure better survival and reduced disease outbreaks.
Salinity also influences water chemistry, including pH, oxygen levels, and the toxicity of ammonia and metals. At higher salinities, toxic ammonia is more likely to convert to its less harmful form. Salinity also impacts mineral availability and gas solubility, making it a vital component of broader water quality management.
In ponds, salinity is affected by water source, rainfall, and evaporation. In recirculating aquaculture systems (RAS), it must be carefully maintained due to minimal water exchange. Continuous monitoring and periodic adjustments, using salt or freshwater, help keep levels stable.
Salinity plays a central role in aquaculture health and productivity. Monitoring and maintaining optimal levels tailored to the species and system type supports efficient growth, reduces stress, and improves overall farm outcomes.
| Species | Ideal Salinity Range | Critical Salinity (Stress/Risk Zone) |
Notes |
|---|---|---|---|
| Tilapia (Oreochromis spp.) | 0 – 10 ppt | >20 ppt (depending on strain) | Primarily freshwater, but some strains tolerate mild brackish water; high salinity stresses osmoregulation. |
| Channel Catfish (Ictalurus punctatus) | 0 – 5 ppt | >10 ppt | Freshwater species; salinity >10 ppt causes stress, poor growth, and mortality. |
| Common Carp (Cyprinus carpio) | 0 – 5 ppt | >10 ppt | Tolerates low brackish water but growth slows beyond 5–8 ppt; prolonged exposure harms health. |
| Rainbow Trout (Oncorhynchus mykiss) | 0 – 8 ppt (for freshwater farming) | >10–12 ppt | Freshwater-adapted; anadromous strains tolerate up to 30 ppt after gradual acclimation. |
| Atlantic Salmon (Salmo salar) | 0 (juvenile) → 30–35 ppt (adult) | Rapid change >5 ppt/day | Juveniles (parr, smolt) need gradual acclimation to seawater; adults thrive in marine salinity. |
| Shrimp (Litopenaeus vannamei) | 5 – 35 ppt | <2 ppt or sudden changes >5 ppt | Very euryhaline; can survive from brackish to full seawater, but sudden shifts are dangerous. |
| Barramundi (Lates calcarifer) | 1 – 30 ppt | Rapid salinity swings >10 ppt/day | Euryhaline species; thrives in both freshwater and seawater with gradual acclimation. |
| Asian Seabass (Lates calcarifer) | 1 – 30 ppt | Rapid salinity swings >10 ppt/day | Needs stable salinity; sudden drops cause osmoregulatory shock. |
| Koi Carp (Cyprinus carpio koi) | 0 – 5 ppt (for general health) | >8–10 ppt | Freshwater ornamental species; salinity above 8 ppt stresses metabolism and reduces vitality. |
The Importance of Ammonium in Aquaculture Farming
Ammonia management is critical in aquaculture because ammonia, a waste product excreted by fish and resulting from decomposing organic matter, is highly toxic even at low concentrations. In water, ammonia exists in two forms: un-ionized ammonia (NH₃), which is highly toxic, and ionized ammonium (NH₄⁺), which is relatively non-toxic. The balance between these forms depends on water temperature and pH—higher temperatures and higher pH favor the more toxic un-ionized form (Boyd, 1998).
High levels of ammonia can cause serious health problems for aquatic species, including gill damage, reduced oxygen uptake, impaired growth, suppressed immune function, and ultimately death (Boyd & Tucker, 2012). Stress from ammonia toxicity often makes fish and shrimp more vulnerable to bacterial and parasitic infections. Chronic exposure to even low levels of ammonia can stunt growth and reduce feed conversion efficiency, leading to economic losses.
In well-managed aquaculture systems, biological filtration—through nitrifying bacteria—converts toxic ammonia into nitrite and then into relatively harmless nitrate. However, if the system is overloaded with waste (from overfeeding or high stocking densities) or if water temperature and pH conditions change, ammonia can quickly accumulate to dangerous levels (Timmons & Ebeling, 2010).
Regular monitoring of total ammonia nitrogen (TAN) and maintaining favorable pH and temperature conditions are essential strategies for preventing ammonia toxicity. Good practices such as controlled feeding, maintaining healthy biofilters, and regular water exchanges are also critical for keeping ammonia at safe levels.
Proper ammonia management not only ensures the health and growth of aquaculture species but is fundamental to sustainable and profitable farming operations.
| Species | Ideal Ammonium (NH₄⁺) Level | Critical NH₄⁺ (Stress/Risk Zone) |
Notes |
|---|---|---|---|
| Tilapia (Oreochromis spp.) | <1.0 mg/L | >3.0 mg/L | Tolerant to some ammonium, but long exposure >3.0 mg/L stresses kidneys and reduces feed intake. |
| Channel Catfish (Ictalurus punctatus) | <1.0 mg/L | >2.5 mg/L | Ammonium buildup lowers dissolved oxygen indirectly by encouraging algal growth and decomposition. |
| Common Carp (Cyprinus carpio) | <1.0 mg/L | >2.0 mg/L | Prolonged high NH₄⁺ damages gill structure and inhibits ammonia excretion, causing stress. |
| Rainbow Trout (Oncorhynchus mykiss) | <0.5 mg/L | >1.0 mg/L | Sensitive species; even "non-toxic" ammonium at high levels (>1 mg/L) stresses respiration. |
| Atlantic Salmon (Salmo salar) | <0.5 mg/L | >1.0 mg/L | Juveniles especially vulnerable; NH₄⁺ interferes with blood ion balance (osmoregulation). |
| Shrimp (Litopenaeus vannamei) | <1.0 mg/L | >2.5 mg/L | Shrimp can tolerate moderate ammonium, but prolonged exposure reduces molting and survival rates. |
| Barramundi (Lates calcarifer) | <1.0 mg/L | >2.0 mg/L | Moderate tolerance; excess ammonium reduces appetite and increases susceptibility to disease. |
| Asian Seabass (Lates calcarifer) | <1.0 mg/L | >2.0 mg/L | Requires careful monitoring especially in intensive systems to avoid chronic stress. |
| Koi Carp (Cyprinus carpio koi) | <1.0 mg/L | >2.0 mg/L | Chronic high ammonium exposure dulls color vibrancy and causes poor growth. |
The Importance of Nitrate in Aquaculture Farming
Nitrate (NO₃⁻) is the final product of the nitrogen cycle in aquaculture systems, resulting from the bacterial oxidation of nitrite. While nitrate is significantly less toxic than ammonia or nitrite, high concentrations over time can still negatively affect aquatic species, particularly in closed and recirculating aquaculture systems (RAS) (Boyd, 1998).
At moderate levels, nitrate is generally tolerated by most fish and shrimp. However, chronic exposure to elevated nitrate levels (typically above 80–100 mg/L for many freshwater species) can cause stress, reduce growth rates, impair reproductive performance, and weaken immune function (Timmons & Ebeling, 2010). Some sensitive species, like marine fish and ornamental species, are even more vulnerable to nitrate accumulation.
Unlike ammonia and nitrite, nitrate does not easily volatilize or break down in water, making its removal more challenging. Methods to control nitrate include water exchange, the use of denitrification systems (which convert nitrate to nitrogen gas under anaerobic conditions), and the integration of plants or algae that uptake nitrate (Boyd & Tucker, 2012).
In well-managed systems, keeping nitrate concentrations low helps maintain optimal fish health, supports better water quality, and enhances sustainability by reducing the need for frequent water replacement. Monitoring nitrate levels regularly is especially important in intensive and high-density farming operations.
While less immediately dangerous than ammonia or nitrite, managing nitrate effectively is crucial for the long-term health and success of aquaculture farms.
| Species | Ideal Nitrate Level | Critical Nitrate (Stress/Risk Zone) |
Notes |
|---|---|---|---|
| Tilapia (Oreochromis spp.) | <50 mg/L | >200 mg/L | Tilapia tolerate moderate nitrate well, but high levels (>200 mg/L) stress kidneys and reduce growth. |
| Channel Catfish (Ictalurus punctatus) | <50 mg/L | >150 mg/L | Resilient species, but chronic exposure >150 mg/L increases disease outbreaks. |
| Common Carp (Cyprinus carpio) | <50 mg/L | >150 mg/L | Good tolerance but prolonged high nitrate affects reproductive health and egg quality. |
| Rainbow Trout (Oncorhynchus mykiss) | <10 mg/L | >50 mg/L | Very sensitive; nitrate >50 mg/L impacts gill function and growth severely. |
| Atlantic Salmon (Salmo salar) | <10 mg/L | >50 mg/L | Juveniles are especially vulnerable; nitrate >50 mg/L lowers survival rates. |
| Shrimp (Litopenaeus vannamei) | <50 mg/L | >100 mg/L | Tolerates moderate nitrate, but long exposure above 100 mg/L reduces molting and immune defense. |
| Barramundi (Lates calcarifer) | <50 mg/L | >100 mg/L | Moderate tolerance; elevated nitrate reduces feed efficiency and weight gain. |
| Asian Seabass (Lates calcarifer) | <50 mg/L | >100 mg/L | Chronic nitrate stress weakens osmoregulation and liver function. |
| Koi Carp (Cyprinus carpio koi) | <50 mg/L | >100 mg/L | High nitrate dulls colors, stunts growth, and makes koi prone to skin infections. |
The Importance of Turbidity in Aquaculture Farming
Turbidity refers to the cloudiness or haziness of water caused by suspended particles such as clay, organic matter, plankton, and uneaten feed. In aquaculture, managing turbidity is important because it affects light penetration, water chemistry, and the health of aquatic species (Boyd, 1998).
Moderate turbidity can be beneficial by providing shade, reducing excessive algal growth, and offering some protection to fish from predators. However, high turbidity—especially from inorganic particles like clay—can cause serious problems. It can clog fish gills, reduce feeding efficiency, stress the animals, and promote the spread of pathogens (Boyd & Tucker, 2012). In addition, excessive turbidity can limit photosynthesis by phytoplankton, which may lead to lower dissolved oxygen production and unstable water conditions.
Organic turbidity, caused by uneaten feed, waste, and decaying organisms, is particularly dangerous. It fuels bacterial growth, leading to oxygen depletion and the buildup of harmful substances like ammonia and nitrite (Timmons & Ebeling, 2010).
Managing turbidity involves practices such as minimizing erosion around ponds, controlling feeding rates, using sedimentation basins, and applying flocculants or coagulants if necessary. Regular monitoring helps ensure that turbidity levels stay within safe ranges for the cultured species—typically less than 25–50 NTU (Nephelometric Turbidity Units) for clear-water species like trout, while more tolerant species like catfish can handle higher levels.
In short, controlling turbidity is crucial not only for maintaining good water quality but also for promoting healthy, productive aquaculture operations.
| Species | Ideal Turbidity Range | Critical Turbidity (Stress/Risk Zone) |
Notes |
|---|---|---|---|
| Tilapia (Oreochromis spp.) | 30–80 NTU | <10 NTU or >150 NTU | Tilapia tolerate moderate turbidity well; very clear water (<10 NTU) increases predation stress; very muddy water (>150 NTU) clogs gills. |
| Channel Catfish (Ictalurus punctatus) | 30–100 NTU | <20 NTU or >150 NTU | Prefer slightly turbid water; high turbidity (>150 NTU) reduces oxygen exchange at gills and affects feeding. |
| Common Carp (Cyprinus carpio) | 30–80 NTU | <10 NTU or >120 NTU | Carp do well in moderately turbid ponds; excessive turbidity (>120 NTU) affects filter feeding and health. |
| Rainbow Trout (Oncorhynchus mykiss) | 5–20 NTU | >25 NTU | Trout need clear water; turbidity >25 NTU stresses gills, reduces visibility, and suppresses feeding. |
| Atlantic Salmon (Salmo salar) | 5–20 NTU | >25 NTU | Salmon also require clear water; chronic turbidity causes gill hyperplasia and stress. |
| Shrimp (Litopenaeus vannamei) | 20–80 NTU | <10 NTU or >150 NTU | Shrimp tolerate a broad range, but heavy solids (>150 NTU) block gill function and settle in gill chambers. |
| Barramundi (Lates calcarifer) | 20–80 NTU | >120 NTU | Moderate turbidity is acceptable; very high turbidity reduces prey visibility and can stress juveniles. |
| Asian Seabass (Lates calcarifer) | 20–80 NTU | >120 NTU | Similar to barramundi; critical to keep balanced during larval stages to prevent feeding problems. |
| Koi Carp (Cyprinus carpio koi) | 10–40 NTU | >80 NTU | Ornamental fish need relatively clear water; high turbidity (>80 NTU) hides colors and stresses skin/mucus layers. |
The Importance of ORP in Aquaculture Farming
Oxidation-Reduction Potential (ORP) measures the ability of water to either release or accept electrons during chemical reactions, serving as an indicator of water quality and overall system health. In aquaculture, ORP is particularly important because it reflects the balance between oxidizing agents (like oxygen) and reducing agents (like organic waste) in the water (Boyd, 1998).
An optimal ORP level, typically between +200 and +300 millivolts (mV), indicates good water quality with sufficient oxygen to support healthy aquatic life (Boyd & Tucker, 2012). When ORP values drop too low (below +150 mV), it suggests poor water quality, a buildup of organic waste, low dissolved oxygen, and potentially toxic conditions such as elevated ammonia or hydrogen sulfide. This environment can stress fish and shrimp, impair their immune systems, and increase mortality rates.
On the other hand, very high ORP levels (above +400 mV), especially when strong oxidizing agents like ozone are used, can also be harmful. Over-oxidation can damage fish gill tissues and lead to oxidative stress (Timmons & Ebeling, 2010).
ORP is especially valuable in intensive systems like recirculating aquaculture systems (RAS), where water quality can change rapidly. Monitoring ORP helps farmers detect early signs of water quality deterioration or biological filter malfunctions before they become visible through other parameters. It can also guide the controlled use of ozone for disinfection without harming the stock.
In summary, maintaining an optimal ORP range is essential for ensuring a healthy, stable environment, maximizing growth, and preventing disease outbreaks in aquaculture farming.
| Species | Ideal ORP Range | Critical ORP (Stress/Risk Zone) |
Notes |
|---|---|---|---|
| Tilapia (Oreochromis spp.) | +150 to +250 mV | <+100 mV | Tilapia thrive in water with good oxygenation and biological activity; low ORP (<+100 mV) indicates poor water quality and potential anaerobic zones. |
| Channel Catfish (Ictalurus punctatus) | +150 to +250 mV | <+100 mV | Channel catfish prefer higher ORP, indicating efficient biological filtration and oxygen availability. Low ORP stresses fish and promotes disease. |
| Common Carp (Cyprinus carpio) | +150 to +250 mV | <+100 mV | Carp tolerate a moderate ORP range, but low ORP (<+100 mV) can impair immune function and growth. |
| Rainbow Trout (Oncorhynchus mykiss) | +200 to +350 mV | <+150 mV | Trout require high ORP (healthy biofilm, good oxygenation) to avoid stress, especially in recirculating systems. ORP below +150 mV indicates poor water quality. |
| Atlantic Salmon (Salmo salar) | +200 to +350 mV | <+150 mV | Salmon, like trout, need a higher ORP to maintain health; low ORP (<+150 mV) results in reduced oxygen and increased risk of bacterial infections. |
| Shrimp (Litopenaeus vannamei) | +150 to +250 mV | <+100 mV | Shrimp are sensitive to low ORP levels; poor oxygenation and anaerobic conditions (<+100 mV) impair molting, growth, and survival. |
| Barramundi (Lates calcarifer) | +150 to +250 mV | <+100 mV | Barramundi require a good balance of oxygen; low ORP (<+100 mV) stresses fish, leading to poor feeding and immune function. |
| Asian Seabass (Lates calcarifer) | +150 to +250 mV | <+100 mV | Similar to barramundi, low ORP (<+100 mV) causes sluggish behavior, reduced feeding, and disease susceptibility. |
| Koi Carp (Cyprinus carpio koi) | +150 to +250 mV | <+100 mV | Ornamental koi require good water quality to maintain color and health; low ORP (<+100 mV) leads to poor water quality and health deterioration. |
The HORIBA Measurement Solutions
With over 75 years of engineering excellence, HORIBA's innovative and diverse range of water quality analyzers, electrodes and solutions are ideal for everyday needs in the laboratory and field through to the most demanding of applications.
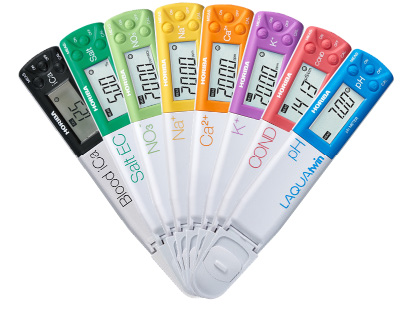
HORIBA LAQUAtwin Pocket Meter Series
The LAQUAtwin pocket meters are compact, lightweight, and highly precise. The series features 15 models covering 10 key parameters, including pH, conductivity, ORP, nitrate, and salinity. These affordable, single-parameter devices are IP67 waterproof and provide fast, reliable water quality measurements on the go.
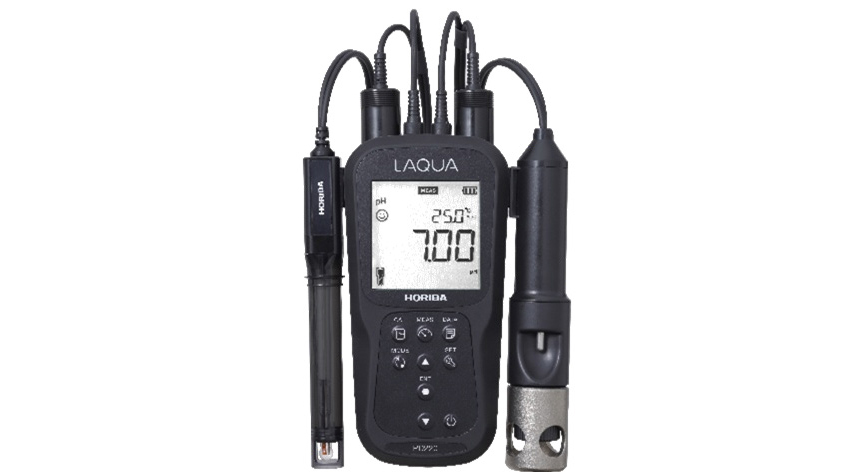
HORIBA LAQUA 200 Series Portable Meters
The LAQUA 200 Series features a selection of 10 IP67 waterproof meters designed for measuring pH, ORP, conductivity, salinity, and dissolved oxygen. Available in single and dual-parameter models, the series includes two product lines: the 210, capable of storing up to 500 data sets, and the 220, which holds up to 1000 data sets and offers PC connectivity. Dissolved oxygen measurements are performed using a reliable galvanic sensor.
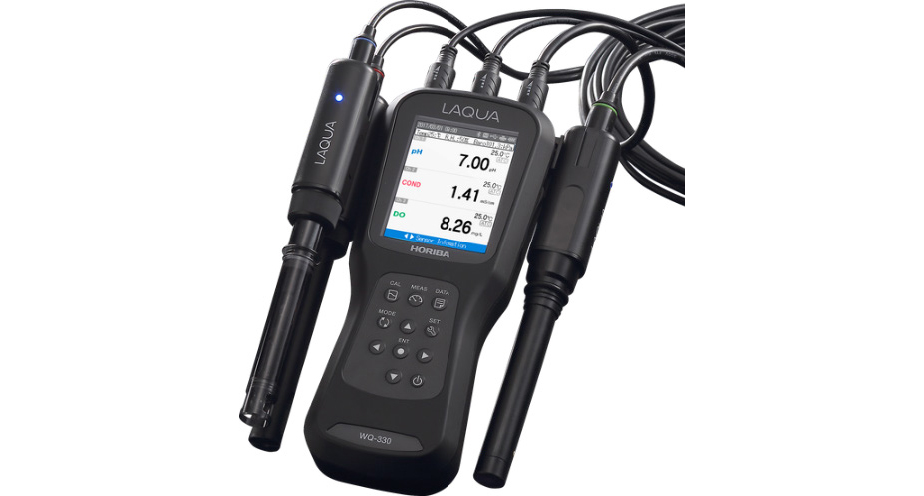
HORIBA LAQUA 300 Series Portable Meters
The LAQUA 300 Series includes three advanced digital meters, with the WQ300 capable of measuring up to three parameters simultaneously in any combination. Supported parameters include pH, ORP, conductivity, salinity, ions, and dissolved oxygen (using an optical probe). The smart electrodes feature built-in memory to store calibration data, allowing seamless transfer between meters without the need for re-calibration.
HORIBA U-50 Series Portable Meters
The U-50 Series is a multi-parameter sonde instrument featuring integrated sensors for pH, ORP, conductivity, salinity, dissolved oxygen, and turbidity—all contained within a single IP68 waterproof housing. The series offers 20 models with various configurations, including options for depth measurement, extended cable lengths, and GPS positioning. Dissolved oxygen is measured using a durable polarographic sensor.
| Product | pH | ORP | DO | Temp | Salinity | NH₃ | NH₄⁺ | NO₃⁻ | Turbidity |
|---|---|---|---|---|---|---|---|---|---|
| LAQUAtwin PH11, PH22, PH33 | ✓ | ✓ | |||||||
| LAQUAtwin Salt11, Salt22 | ✓ | ✓ | |||||||
| LAQUAtwin NO3-11 | ✓ | ✓ | |||||||
| LAQUAtwin ORP-11 | ✓ | ✓ | |||||||
| PH210, PH220 | ✓ | ✓ | ✓ | ✓ | |||||
| PC210, PC220 | ✓ | ✓ | ✓ | ✓ | ✓ | ||||
| PD210, PD220 | ✓ | ✓ | ✓ | ✓ | |||||
| WQ310, WQ320, WQ330 | ✓ | ✓ | ✓ | ✓ | ✓ | ✓ | ✓ | ✓ | ✓ |
| U-51 | ✓ | ✓ | ✓ | ✓ | ✓ | ||||
| U-52, U-53, U-54 | ✓ | ✓ | ✓ | ✓ | ✓ | ✓ | |||
| TB220 | ✓ |
Matching products
")
HORIBA pH Handheld Tester – Ideal for Water and Environmental Analysis Precise pH measurements on-site – compact, reliable, and easy to use The Horiba LAQUAtwin pH tester is ideal for water quality testing in rivers, drinking water, and process water. With a measurement range of 0.0 to 14.0 pH and a 2-point calibration, the tester is suitable for a wide range of pH analyses. Just a single drop of sample provides quick and reliable measurement results. The tester combines electrode, display, and sample container in a robust IP67-rated housing that is dust- and waterproof. The digital display with backlight shows both pH and mV values. Features such as automatic stability detection and Auto-Hold simplify operation. With up to 400 hours of battery life, the tester is suitable for extended measurement series. Included are calibration buffer solutions (pH 4.01 & 7.00), batteries, pipette, instruction manual, and a carrying case. Handheld pH tester for fast and precise results With its wide measurement range and 2-point calibration, the Horiba LAQUAtwin pH tester is suitable for a variety of pH analyses. Even a single drop of sample is enough to obtain fast and accurate results. Its compact design makes the mobile pH tester highly user-friendly and allows on-site measurements without complex sample preparation or laboratory infrastructure. Robust, waterproof design with comprehensive features The tester integrates the electrode, display, and sample container in a robust IP67-rated housing that is dust- and waterproof. The digital backlit display clearly shows pH and mV values. Features like automatic stability detection and Auto-Hold simplify daily use. With a battery life of up to 400 hours, the tester is suitable for long measurement series. The package includes calibration buffer solutions (pH 4.01 & 7.00), batteries, pipette, instruction manual, and a practical carrying case. Typical applications of the Horiba LAQUAtwin pH Pocket Tester Aquaculture and corals Aquariums Beer, beverages, and food Heating systems Laboratories and schools Horticulture Water treatment Frequently asked questions How long is the warranty period for HORIBA pocket testers? The warranty period is two years from delivery for commercial customers. How many measurements can be taken before the sensor needs to be replaced? This varies depending on the application, use and storage of the Horiba tester. As a rule, the sensor should be replaced after one year. How long is the warranty period for replacement sensors for pocket testers? The warranty period is 12 months after delivery for commercial customers. How do you clean the pocket tester? The pocket tester can be rinsed under water. We recommend cleaning with DI water (deionised). Tissue paper is recommended for drying after cleaning. How can the pocket tester be reset to factory settings? (e.g. in the event of an incorrect measurement result) This information can be found in the operating instructions. These can be found in the download area of the shop and on the product. Is calibration necessary before each measurement? Basically, yes. Further information can be found in the operating instructions.
")
Manufacturer Part No. 3999960128 LAQUAtwin SALT-11 : The world's first pocket-sized salinity analyser. Your mobile laboratory - for use on site: Ideal for water quality testing in aquariums, food and many other applications. HORIBA's unique compact meter integrates electrode, display and sample container to enable simple, effective on-site testing by direct measurement with a single drop. Minimum sample volume: 0.12 ml Displays salinity and temperature Up to 2 calibration points Automatic calibration Automatic standard detection: 0.50 & 5.00 % NaCl Automatic temperature compensation: 2%/ºC fixed Temperature calibration: 5 to 40.0 ºC 2 salinity curves: NaCl & seawater Automatically stable / automatically maintained measurement Automatic switch-off: 30 min. Low battery indicator IP67 rating dust and waterproof Replaceable sensor 400 hours battery life: continuous operation without backlight Material: ABS epoxy housing and titanium coating with platinum black sensor Display: customised (monochrome) digital LCD with backlight Operating conditions: 5 to 40°C, 85% or less relative humidity Warranty: 2 years - meter, 6 months - sensor Packed in a practical carrying case Supplied with 0.5 % and 5.0 % NaCl standards (14 ml each), conditioning solution (4 ml), 2 x CR2032 batteries, pipette, instructions and short manual
")
Manufacturer Part No. 3200965260 LAQUAtwin ORP-11: The world's first pocket-sized ORP and Eh meter Your mobile laboratory - for use on site: Ideal for water quality tests in swimming pools, environmental tests and many other applications. HORIBA's unique compact meter integrates electrode, display and sample container to enable simple, effective on-site testing by direct measurement with a single drop. Versatile measurement: The only pocket-sized ORP meter that can measure not only the ORP value but also the Eh value (voltage measurement versus the standard hydrogen electrode or SHE) Precision in every drop: The replaceable sensor with platinum disc enables measurements in samples as small as 0.3 ml (or 0.05 ml with sampling sheet). Wide measuring range: With a measuring range from -1000 mV to 1000 mV, the meter ensures accurate readings over a wide range. Simple automatic one-point calibration: The meter automatically recognises and calibrates the 225 mV standard solution included in the kit. The calibration can be adjusted with a different ORP standard solution. Exceptional accuracy: With an accuracy of +/- 2 mV, the meter delivers precise results every time. Auto Stable & Auto Hold measurement modes: To help users record stable readings, the meter displays a smiley face and can freeze the reading. Temperature Compensation and Calibration: The meter displays temperatures up to 50.0 °C and allows for temperature compensation and correction through its calibration function. IP67 rating: Water and dustproof meter with digital LCD display and backlighting Complete package for ORP testing on the go: Each ORP-11 meter comes with a 225 mV ORP standard solution (14 ml), a cotton swab for polishing the platinum disc, a pipette, batteries and 5 sampling sheets.
 Tester with 2 calibration points and temperature measurement (NO3-11)")
Horiba LAQUAtwin Nitrate Ion Tester NO3-11 for Precise On-Site Measurements Handheld tester with 2-point calibration, ideal for water and environmental measurements The Horiba LAQUAtwin Nitrate Ion Tester (NO3-11) is a portable device for direct determination of nitrate ions (NO3) and temperature in liquids and samples. Thanks to the ion-selective electrode and compact design, the tester delivers fast and reliable results. The integrated temperature unit enables temperature-compensated analysis and clearly displays both nitrate and temperature values on the digital LCD display. Mobile Nitrate Ion Tester for Precise On-Site Analyses The integrated temperature measurement enables temperature-compensated analysis and shows both nitrate and temperature values. Only very small sample volumes are required, minimizing sample consumption and increasing efficiency in daily use. The tester can be set up with up to two calibration points, with features such as automatic standard recognition, adjustable calibration values, and multiplication compensation for flexibility. Only minimal sample volumes are needed for each analysis, reducing sample usage and improving efficiency. Why Nitrate Measurement Is Crucial – and a Pocket Tester from Horiba Is Ideal Nitrate measurement plays a central role in agriculture, water management, and environmental monitoring. Elevated nitrate concentrations can affect drinking water quality, stress ecosystems, and contribute to over-fertilization. At the same time, nitrate is an essential nutrient for plants, and targeted control is vital for sustainable agriculture. A mobile nitrate pocket tester enables rapid on-site analysis without time-consuming laboratory tests. This allows early detection of contamination, immediate action, and reliable monitoring of legal limits. The Horiba LAQUAtwin NO3-11 combines this flexibility with high measurement accuracy and easy operation – ideal for routine checks and scientific applications. The tester can be configured with up to two calibration points. Features like automatic standard recognition, adjustable calibration values, and multiplication compensation provide high adaptability to different sample types and measurement conditions. Typical Applications of the Horiba LAQUAtwin Nitrate Ion Tester (NO3-11) Agriculture: To optimize fertilizer use, promote plant growth, and minimize environmental impact, farmers and agronomists use the tester to monitor nitrate levels in soils and irrigation water. Water Quality Management: To maintain nitrate concentrations within safe limits, the NO3-11 is used in water management to check drinking and wastewater quality. Environmental Monitoring: The NO3-11 allows environmental technicians and scientists to quickly analyze nitrate contamination in rivers, lakes, and groundwater, ensuring compliance with environmental standards and identifying pollution sources. Research and Development: The tester is used by scientists in environmental science, hydrology, and soil science to conduct detailed studies of the nitrogen cycle and the effects of nitrates on ecosystems. Frequently asked questions How long is the warranty period for HORIBA pocket testers? The warranty period is two years from delivery for commercial customers. How many measurements can be taken before the sensor needs to be replaced? This varies depending on the application, use and storage of the Horiba tester. As a rule, the sensor should be replaced after one year. How long is the warranty period for replacement sensors for pocket testers? The warranty period is 12 months after delivery for commercial customers. How do you clean the pocket tester? The pocket tester can be rinsed under water. We recommend cleaning with DI water (deionised). Tissue paper is recommended for drying after cleaning. How can the pocket tester be reset to factory settings? (e.g. in the event of an incorrect measurement result) This information can be found in the operating instructions. These can be found in the download area of the shop and on the product. Is calibration necessary before each measurement? Basically, yes. Further information can be found in the operating instructions.

The high-quality multi-parameter hand-held meters of the LAQUA 200 series manufactured by Horiba are suitable for use in the field under any conditions and in direct daylight thanks to their monochrome LCD display with LED backlight. Another advantage of these devices is that the hand-held meters are very shock and scratch resistant due to the special rubber coating and offer a long operating time due to the AA 2500 mAh batteries used. An IP67 certification, which certifies dust-tightness and protection against temporary submersion for up to 30 minutes at a water depth of one metre, rounds off the professional overall package in addition to the ergonomic design and simple operation. In the certainty of producing high-quality devices, the manufacturer Horiba offers you a three-year guarantee on the hand-held measuring devices of the LAQUA 200 series. During the measurements, the user is supported by the display of instructions in the form of smiley symbols. This is intended to prevent operating errors that can lead to implausible measurement results. Furthermore, the measuring device has only 9 keys and no menu texts. This design decision serves, among other things, to ensure that the device can be operated as easily as possible during discontinuous use or when used by other users. The Horiba meters have an electrode wear indicator, a lock function to "save" the current measured value on the display, automatic calibration functions and a self-diagnostic function. The fold-out stand on the back of the units means that you always have your hands free to carry out your measurements easily and safely. Instruments marked as "Kit" are delivered in a reinforced measuring case for mobile use in the open air. This contains the exchangeable measuring electrode, the corresponding cable which is connected to the device and the electrode, as well as the appropriate buffer or calibration solutions and instructions. If you want to carry out measurements of different parameters with different electrodes, you can simply connect the electrodes to each other at the upper part and then immerse them in the measuring solution. PH220 version with GLP functions Measurement data storage of 1000, instead of 500 data sets Measurement and calibration data are stored GLP compliant with date and time stamp PC communication via optional USB cable RS232 printer function to print the measurement data Scope of delivery: PH210 or PH220 handheld meter 2x AA battery Robust measuring case manual and quick reference guide Manufacturer article number: 3200779537 (PH210) 3200779538 (PH220)

The high-quality multi-parameter hand-held meters of the LAQUA 200 series manufactured by Horiba are suitable for use in the field under any conditions and in direct daylight thanks to their monochrome LCD display with LED backlight. Another advantage of these devices is that the hand-held meters are very shock and scratch resistant due to the special rubber coating and offer a long service life due to the AA 2500 mAh batteries used. An IP67 certification, which certifies dust-tightness and protection against temporary submersion for up to 30 minutes at a water depth of one metre, rounds off the professional overall package in addition to the ergonomic design and simple operation. In the certainty of producing high-quality devices, the manufacturer Horiba offers you a three-year guarantee on the hand-held measuring devices of the LAQUA 200 series. During the measurements, the user is supported by the display of instructions in the form of smiley symbols. This is to prevent operating errors that can lead to implausible measurement results. Furthermore, the measuring device has only 9 keys and no menu texts. This design decision serves, among other things, to ensure that the device can be operated as easily as possible during discontinuous use or when used by other users. The Horiba meters have an electrode wear indicator, a lock function to "save" the current measured value on the display, automatic calibration functions and a self-diagnosis function. The fold-out stand on the back of the devices means that you always have your hands free to carry out your measurements easily and safely. Version PC220 with GLP functions Measurement data storage of 1000, instead of 500 data sets Measurement and calibration data are stored GLP compliant with date and time stamp PC communication via optional USB cable RS232 printer function to print the measurement data Scope of delivery: Handheld meter PC210 or PC220 2x AA battery manual and quick reference guide Manufacturer article number: 3200779543 (PC210) 3200779544 (PC220)

The high-quality multi-parameter hand-held meters of the LAQUA 200 series manufactured by Horiba are suitable for use in the field under any conditions and in direct daylight thanks to their monochrome LCD display with LED backlight. Another advantage of these devices is that the hand-held meters are very shock and scratch resistant due to the special rubber coating and offer a long operating time due to the AA 2500 mAh batteries used. An IP67 certification, which certifies dust-tightness and protection against temporary submersion for up to 30 minutes at a water depth of one metre, rounds off the professional overall package in addition to the ergonomic design and simple operation. In the certainty of producing high-quality devices, the manufacturer Horiba offers you a three-year guarantee on the hand-held measuring devices of the LAQUA 200 series. During the measurements, the user is supported by the display of instructions in the form of smiley symbols. This is intended to prevent operating errors that can lead to implausible measurement results. Furthermore, the measuring device has only 9 keys and no menu texts. This design decision serves, among other things, to ensure that the device can be operated as easily as possible during discontinuous use or when used by other users. The Horiba meters have an electrode wear indicator, a lock function to "save" the current measured value on the display, automatic calibration functions and a self-diagnostic function. The fold-out stand on the back of the units means that you always have your hands free to carry out your measurements easily and safely. PD220 version with GLP functions Measurement data storage of 1000, instead of 500 data sets Measurement and calibration data are stored GLP compliant with date and time stamp PC communication via optional USB cable RS232 printer function to print the measurement data Scope of delivery: Hand-held meter PD210 or PD220 2x AA battery manual and quick reference guide Manufacturer article number: 3200779545 (PD210) 3200779546 (PD220)

Thank you for your interest in our smart and customizable Horiba WQ-300 series instruments.The high-quality digital multi-parameter handheld meters with their generous color LCD display with LED backlight (7 cm x 5.2 cm) are ideally suited for use in the field under all conditions and in direct daylight.Use our configurator to freely select the suitable measuring device of the WQ-300 Horiba series (1 to 3 channels), the measuring parameters (sensor cartridges) and desired cable length (with integrated sensor receptacle + digital module) according to your wishes and requirements. At a later stage, you can always connect another available measurement parameter to the device via the corresponding sensor cable or carry it in the case as a supplement. As with other handheld measuring devices from Horiba, a major advantage of these devices is that the measuring devices are highly resistant to shock, slipping and scratching thanks to a special rubber coating. Only four standard AA 2500 mAh batteries are required for operation, and to give you more flexibility when you are on the move, the WQ-300 series devices can also be powered by a powerbank or battery pack via the integrated USB interface. The IP67 certification, which certifies dustproofness and protection against temporary submersion for up to 30 minutes at a water depth of one meter, completes the overall professional package, along with the usual ergonomic design and ease of user operation. Horiba attests to its outstanding product quality by offering a three-year warranty on the LAQUA WQ-300 series handheld meters. Other added values and features:During analyses, the user is supported by the display of operating instructions in the form of smiley icons, which is supplemented by an LED status display on the sensor. This is intended to prevent operating errors, which can lead to implausible measurement results. The design decision to install only a small number of control buttons and not to implement any nested user menus serves to ensure that the devices can be operated easily and safely even during discontinuous use as well as when used by other users. The measuring instruments have an electrode wear indicator, a measuring stability indicator on the instrument and sensor, a locking function to "save" the currently measured value on the display, free naming of the measuring point (8 characters), automatic calibration functions, integrated sensor holders, self-diagnosis function, as well as GLP functions. The fold-out stand on the back of the instruments means that you always have your hands free to carry out your measurements easily and safely. Measurement data can be conveniently transferred to your computer or cell phone via USB or WiFi.All handheld meters of the 300 series are delivered in a reinforced measuring case for mobile use in the open air. This provides space for the meter, for electrodes and cables, for up to eight 60 ml bottles of buffer solutions including an integrated buffer solution bottle holder for easier calibration. Particularly noteworthy is the automatic sensor recognition of the instrument through the use of sensor cables with integrated digital sensor recording. Information about the sensor, calibration data as well as measurement settings are stored in the sensor recording and transmitted to the measuring instrument. In addition, calibration of all connected sensors is possible at the same time, since each sensor head independently stores the measurement and calibration data and transmits it to the WQ300 series measuring device.Optionally, there is the possibility to connect and use analog sensors via the Horiba BNC sensor adapter with the device, please contact us for this.Languages:GermanEnglishFrenchSpanishPortugueseChineseScope of delivery:WQ-300 series handheld meter in a carrying casethe digital electrode you have chosen, if applicable, and the corresponding sensor-specific cable with integrated digital sensor receptaclemanualManufacturer article number single measuring device WQ-310-K 1 channel: 3200832605 Note: Chloride sensor, if selected, is supplied without chloride ion strength regulator and chloride electrode filling solution. This must be procured by the customer. Without the filling solution the sensor can´t be used. Why We Use These Measuring Devices in Water Treatment Precise calcium control is a key element of efficient water treatment – from drinking water purification and process water management to environmental analysis. Elevated calcium levels can lead to scaling, pipe damage, energy losses, and disruptions in chemical processes. For this purpose, we offer tailored high-end solutions from the Horiba LAQUA WQ Series (WQ310-K, WQ320-K, WQ330-K) in our online shop, specifically designed to meet the needs of water technology: WQ310-K: Single-parameter solution for targeted measurements • WQ320-K: Simultaneous monitoring of, for example, calcium and conductivity • WQ330-K: Three-channel measurement for complex real-time multi-parameter analyses Why We Rely on These Devices: • They provide reliable data for controlling and optimizing water treatment systems • They offer digital evaluation, documented results, and interfaces for process integration • They are robust, packaged in a practical analysis case, and thus also suitable for mobile on-site use • They allow calcium to be measured in combination with other parameters such as pH, conductivity, or redox – for a holistic and efficient approach

Thank you for your interest in our smart and customizable Horiba WQ-300 series instruments.The high-quality digital multi-parameter handheld meters with their generous color LCD display with LED backlight (7 cm x 5.2 cm) are ideally suited for use in the field under all conditions and in direct daylight.Use our configurator to freely select the suitable measuring device of the WQ-300 Horiba series (1 to 3 channels), the measuring parameters (sensor cartridges) and desired cable length (with integrated sensor receptacle + digital module) according to your wishes and requirements. At a later stage, you can always connect another available measurement parameter to the device via the corresponding sensor cable or carry it in the case as a supplement. As with other handheld measuring devices from Horiba, a major advantage of these devices is that the measuring devices are highly resistant to shock, slipping and scratching thanks to a special rubber coating. Only four standard AA 2500 mAh batteries are required for operation, and to give you more flexibility when you are on the move, the WQ-300 series devices can also be powered by a powerbank or battery pack via the integrated USB interface. The IP67 certification, which certifies dustproofness and protection against temporary submersion for up to 30 minutes at a water depth of one meter, completes the overall professional package, along with the usual ergonomic design and ease of user operation. Horiba attests to its outstanding product quality by offering a three-year warranty on the LAQUA WQ-300 series handheld meters. Other added values and features:During analyses, the user is supported by the display of operating instructions in the form of smiley icons, which is supplemented by an LED status display on the sensor. This is intended to prevent operating errors, which can lead to implausible measurement results. The design decision to install only a small number of control buttons and not to implement any nested user menus serves to ensure that the devices can be operated easily and safely even during discontinuous use as well as when used by other users. The measuring instruments have an electrode wear indicator, a measuring stability indicator on the instrument and sensor, a locking function to "save" the currently measured value on the display, free naming of the measuring point (8 characters), automatic calibration functions, integrated sensor holders, self-diagnosis function, as well as GLP functions. The fold-out stand on the back of the instruments means that you always have your hands free to carry out your measurements easily and safely. Measurement data can be conveniently transferred to your computer or cell phone via USB or WiFi.All handheld meters of the 300 series are delivered in a reinforced measuring case for mobile use in the open air. This provides space for the meter, for electrodes and cables, for up to eight 60 ml bottles of buffer solutions including an integrated buffer solution bottle holder for easier calibration. Particularly noteworthy is the automatic sensor recognition of the instrument through the use of sensor cables with integrated digital sensor recording. Information about the sensor, calibration data as well as measurement settings are stored in the sensor recording and transmitted to the measuring instrument. In addition, calibration of all connected sensors is possible at the same time, since each sensor head independently stores the measurement and calibration data and transmits it to the WQ300 series measuring device.Optionally, there is the possibility to connect and use analog sensors via the Horiba BNC sensor adapter with the device, please contact us for this.Languages:GermanEnglishFrenchSpanishPortugueseChineseScope of delivery:WQ-300 series handheld meter in a carrying casethe digital electrode you have chosen, if applicable, and the corresponding sensor-specific cable with integrated digital sensor receptaclemanualManufacturer article number single measuring device WQ-320-K 2 channel: 3200832606 Note: Chloride sensor, if selected, is supplied without chloride ion strength regulator and chloride electrode filling solution. This must be procured by the customer. Without the filling solution the sensor can´t be used.

Horiba WQ330-K – Your Professional 3-Channel Water Quality Meter Expandable multi-parameter system for simultaneous measurement of pH, conductivity, redox, and other water parameters The Horiba LAQUA WQ330-K is a powerful multi-channel device for advanced water analysis, both on-site and in the laboratory. With three freely configurable measurement channels, it can simultaneously record parameters such as pH, conductivity, redox potential, TDS, temperature, oxygen, ammonia, calcium, chloride, nitrate, fluoride, and potassium. Intuitive operation, automatic sensor recognition, and digital calibration ensure accurate, fast, and reproducible measurements. Flexible Multi-Parameter System for Field and Laboratory Applications The analysis kit with the Horiba WQ330-K is ideal for environmental and water body monitoring, research and teaching, as well as drinking and process water control. The large LCD display with LED backlight ensures excellent readability even in direct sunlight. Measurement data can be exported and documented via USB or wirelessly, greatly simplifying traceability and analysis. The modular system allows the device to be quickly and precisely adapted to any measurement task. It is ideal for users who need to efficiently and reliably monitor multiple water parameters. Technical Features and Key Advantages of the WQ330-K The three measurement channels of the Horiba WQ330-K enable simultaneous recording of different water parameters, reducing measurement time and allowing better evaluation of relationships between parameters. The modular sensor concept allows flexible use of digital sensors, which are automatically recognized and store their calibration history. Notably, the combination of high measurement precision, user-friendliness, and mobility makes this device stand out. Quick deployment without complicated setup, along with easy data transfer for documentation and analysis, makes the Horiba LAQUA WQ330-K an ideal solution for professional water analytics. Frequently asked questions How long is the warranty period for HORIBA analysers? The warranty period is 2 years for the 300 (WQ) series and 1 year for the F series after delivery. Where can I find suitable replacement electrodes or buffer solutions? You can find the appropriate replacement electrodes and buffer solutions in the shop under the main item at the bottom of the cross-selling section. How do I clean the probe before calibration? The sensors should be cleaned with DI water (deionised). After cleaning, wipe them with tissue paper if possible.